Important Curves & Graphs in Economics
-
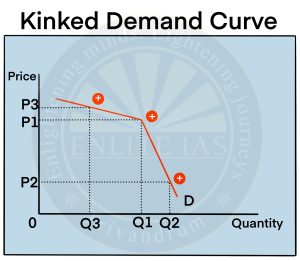
Kinked Demand Curve
- The kinked demand curve of oligopoly was developed by Paul M. Sweezy in 1939. The model explains the behaviour of oligopolistic organisations. It advocates that the behaviour of oligopolistic organisations remains stable when the price and output are determined.
-
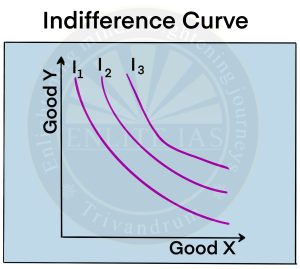
Indifference Curve
- An Indifference curve, with respect to two commodities, is a graph showing those combinations of the two commodities that leave the consumer equally well off or equally satisfied—hence indifferent—in having any combination on the curve.