Important Curves & Graphs in Economics
-
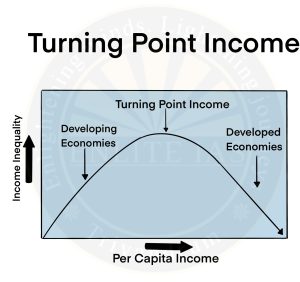
Kuznets Curve
- A Kuznets curve is a graphical representation of market forces and income as and when an economy develops. The Kuznets curve was first developed by economist Simon Kuznets in the 1950s and 1960s.
-
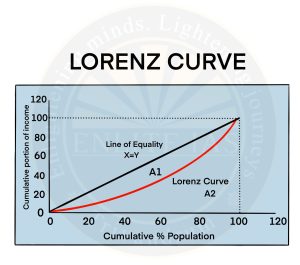
Lorenz Curve
- it is a graphical representation of the distribution of income or wealth. The Lorenz curve was developed by Max O. Lorenz in 1905.
-
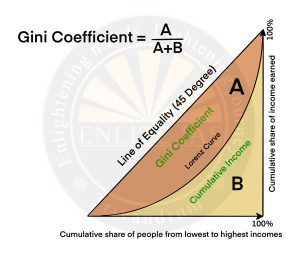
Gini Coefficient
- The Gini coefficient measures income inequality, ranging from 0 (perfect equality) to 1 (perfect inequality).